Collection by NikahGeh
232 designs in this collection
Three Bar Charts With Increasing Height Representing Growth And Progress
A Graphic Illustration Showing A Data Comparison In An Icon
A Visual Representation Of Statistical Data And Information Analysis
Colorful Pie Chart Slices, Pastel Colors, Creative Design, Geometric Shapes.
Colorful Pie Chart Representation Of Data Analysis And Statistics.

Pink Arrow Pointing Upwards On A Light Blue Background.
Colorful 3d Rendered Chart And Pie Graph On A Teal Base.
Simple Pie Chart Icon With One Quarter Segment Highlighted In Dark Gray
Colorful Bar Graph Icon On A Square Background With A Yellow Backdrop.
Colorful 3d Render Of A Business Chart And Pie Chart On A Pink Background.
Colorful 3d Render Of A Bar Graph And Pie Chart On A Blue Background.
Modern App Icon Design - A Stylish And Colorful Digital Interface.
Financial Growth Visualization - Upward Arrow And Bar Chart.

Business Analytics Concept With A Person And A Graph.
Colorful 3d Bar Chart Icon On A Pastel Background.
Colorful 3d Bar Chart Icon On A Purple Background.
Ascending Bar Graph With Arrow: Business Growth Icon
Red And White Icon With Bar Chart For Business Analysis.
Blue Icon With Graph And Arrow Symbolizing Business Growth And Analytics.
Colorful Bar Graph Showing Growth And Progress In Business.
Colorful Pie Chart Representing Data Analysis And Statistics.
Green Icon With A Chart And Document Symbol.

Colorful 3d Graph Icon On A Light Orange Background.

Colorful Gradient Bar Chart Rising On Purple Surface.
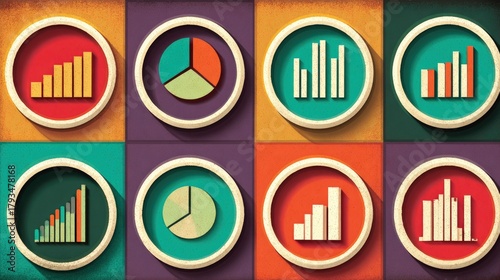
Colorful Data Visualization Icons Representing Various Statistical Information.
3d Rendered Growth Icon On White Background.
3d Rendered Business Growth Icon On White Background.

Business Professional Standing In Front Of Charts And Graphs.
Colorful Arrow Symbolizing Growth And Progress On Pink Background.
Colorful 3d Rendered Pie Chart And Bar Graph On Pink Background.
Colorful 3d Rendered Business And Financial Data Icons.
Colorful 3d Graph Icon On A Yellow Background.
Colorful 3d Bar Graph Illustrating Growth And Progress.
Colorful Gradient Bar Chart Illustrating Growth And Progress.
Colorful Data Analysis Icon On A Light Blue Background.
Colorful 3d Rendered Chart Illustrating Growth And Progress.
Colorful 3d Bar Chart Icon On Yellow Background.
Colorful 3d Cubes Representing Data Visualization And Growth.
Colorful Growth Chart Icon - Business And Progress Visualization.