Decorly Solutions

Custom made-to-measure wall coverings including wallpapers and pattern designs. Transform your space with our premium materials and worldwide shipping.

Shop

  • All Products
  • Collections
  • Categories
  • Shop by Room
  • Inspiration Gallery

Customer Service

  • Contact Us
  • Shipping Info
  • Returns & Exchanges
  • Size Guide
  • FAQ

Company

  • About Us
  • Privacy Policy
  • Terms of Service
CURRENCY

© 2026 Decorly Solutions. All rights reserved.

PrivacyTermsCookies
Customer photosInspirationDIYTrade ProgramContact
Decorly
HomeDesignsCollection

Collection by NikahGeh

148 designs in this collection

A report with graphs and lines containing some statistical data

A Report With Graphs And Lines Containing Some Statistical Data

An illustration depicts a circular gauge showing statistical data displayed

An Illustration Depicts A Circular Gauge Showing Statistical Data Displayed

A person is analyzing data displayed on a screen or monitor

A Person Is Analyzing Data Displayed On A Screen Or Monitor

Various graphic charts and data analysis information icons are shown

Various Graphic Charts And Data Analysis Information Icons Are Shown

An illustration depicting various statistical data visualization charts

An Illustration Depicting Various Statistical Data Visualization Charts

Various stylized graphical icons representing data visualization and analysis

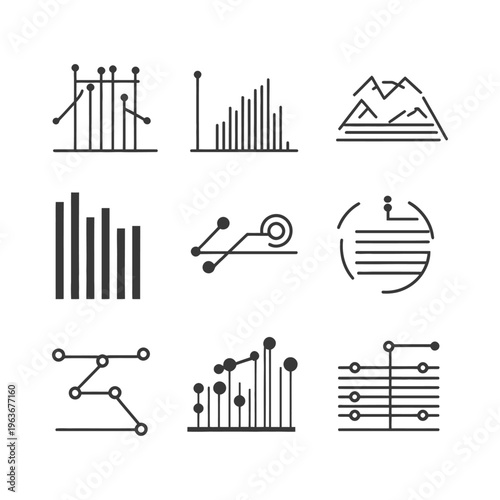
Various Stylized Graphical Icons Representing Data Visualization And Analysis

An upward trending business growth chart icon illustrated simply

An Upward Trending Business Growth Chart Icon Illustrated Simply

Simple black and white illustration representing rising trends and achievements

Simple Black And White Illustration Representing Rising Trends And Achievements

An upward trending line graph displaying business financial growth over time

An Upward Trending Line Graph Displaying Business Financial Growth Over Time

A business graph showing an upward trend and past downturn

A Business Graph Showing An Upward Trend And Past Downturn

Simple black and white chart representing financial growth analysis

Simple Black And White Chart Representing Financial Growth Analysis

Three bar charts with increasing height representing growth and progress

Three Bar Charts With Increasing Height Representing Growth And Progress

A graphic illustration showing a data comparison in an icon

A Graphic Illustration Showing A Data Comparison In An Icon

A business data analysis and reporting process depicted in black lines

A Business Data Analysis And Reporting Process Depicted In Black Lines

A visual representation of statistical data and information analysis

A Visual Representation Of Statistical Data And Information Analysis

A graphic representation of financial data and business information

A Graphic Representation Of Financial Data And Business Information

A simple graphic showing data analysis with a line graph and bars

A Simple Graphic Showing Data Analysis With A Line Graph And Bars

Simple Pie Chart Icon with One Quarter Segment Highlighted in Dark Gray

Simple Pie Chart Icon With One Quarter Segment Highlighted In Dark Gray

Colorful Bar Graph Icon on a Square Background with a Yellow Backdrop.

Colorful Bar Graph Icon On A Square Background With A Yellow Backdrop.

Colorful 3D Bar Chart Icon on a Pastel Background.

Colorful 3d Bar Chart Icon On A Pastel Background.

Ascending Bar Graph with Arrow: Business Growth Icon

Ascending Bar Graph With Arrow: Business Growth Icon

Red and White Icon with Bar Chart for Business Analysis.

Red And White Icon With Bar Chart For Business Analysis.

Blue Icon with Graph and Arrow Symbolizing Business Growth and Analytics.

Blue Icon With Graph And Arrow Symbolizing Business Growth And Analytics.

Colorful Data Visualization Icons Representing Various Statistical Information.

Colorful Data Visualization Icons Representing Various Statistical Information.

3D Rendered Growth Icon on White Background.

3d Rendered Growth Icon On White Background.

Colorful 3D Bar Chart Icon on Yellow Background.

Colorful 3d Bar Chart Icon On Yellow Background.

Ascending Bar Graph with Trend Line Icon, Business Growth Concept

Ascending Bar Graph With Trend Line Icon, Business Growth Concept

Colorful digital display showing graphic data analysis.

Colorful Digital Display Showing Graphic Data Analysis.

Minimalist Bar Graph Icon in Dark Gray on White Background

Minimalist Bar Graph Icon In Dark Gray On White Background

Bell Curve Outline: Statistical Distribution Graphic in Dark Gray on White Background

Bell Curve Outline: Statistical Distribution Graphic In Dark Gray On White Background

Ascending Bar Graph Icon: Simple, Minimalist Design on White Background

Ascending Bar Graph Icon: Simple, Minimalist Design On White Background

Minimalist Line Graph Icon: Fluctuating Data Visualization on White Background

Minimalist Line Graph Icon: Fluctuating Data Visualization On White Background

Simple Bar Graph Icon: Data Visualization, Business, Statistics, Progress, Growth.

Simple Bar Graph Icon: Data Visualization, Business, Statistics, Progress, Growth.

Simple Line Graph with Circular Data Points on White Background

Simple Line Graph With Circular Data Points On White Background

Ascending Bar Graph Icon: Simple, Clean, and Modern Design for Data Visualization

Ascending Bar Graph Icon: Simple, Clean, And Modern Design For Data Visualization

Ascending Bar Graph Icon: Minimalist Design for Data Visualization

Ascending Bar Graph Icon: Minimalist Design For Data Visualization

Rising Trend Line Graph with Circular Data Points on White Background

Rising Trend Line Graph With Circular Data Points On White Background

Ascending Bar Graph with Arrow: Business Growth Icon

Ascending Bar Graph With Arrow: Business Growth Icon

Minimalist Line Graph Icon: Data Visualization with Connected Circles

Minimalist Line Graph Icon: Data Visualization With Connected Circles

Ascending Bar Graph Icon: Growth, Progress, and Positive Trend Illustration

Ascending Bar Graph Icon: Growth, Progress, And Positive Trend Illustration